
To install the AfterGlow for Splunk application, follow these simple steps:
afterglow.spl file. Save this file on your computer.Once the app is installed and you open it for the first time by navigating to the "App" menu entry on the top right and selecting AfterGlow, you will be asked to configure where your GraphViz installation resides. Find your 'neato' binary on your machine and enter the path here. Also indicate where your Perl installation resides. [Note, this only matters for Windows. On UNIX we don't use this configuration.]
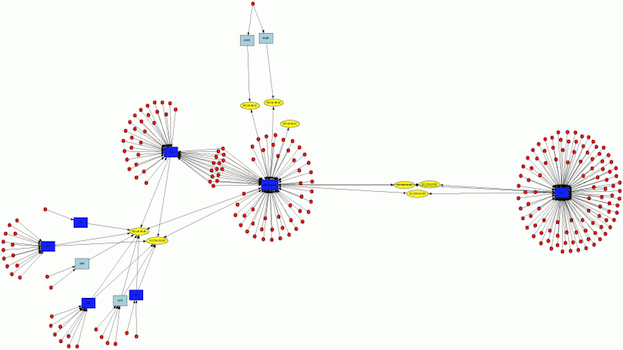
Congratulations, You are ready to graph your data!
In order for AfterGlow to run with Splunk, you need GraphViz installed on your machine. On some Linux distributions, you have to install graphviz-gd to enable GIF output for GraphViz. On Windows, make sure you have a version of Perl installed as well (e.g., ActivePerl). These are the ONLY dependency.
To generate any graphs, you have to navigate to the AfterGlow app inside of Splunk. Then, in the search bar, enter any search and you will see a graph visualization of your data. For example, type the following search (assuming you have some data with the keyword 'failure' in them:
failure
This is literally all you have to enter. I recommend starting with this though:
failure | head 100
That way you don't overload AfterGlow with too many events. By default, AfterGlow will use the source, the sourcetype, and the host as fields to be visualized. You can easily change that by explicitly specifying the fields you want to visualize:
failure | fields + src_ip, dest_ip
or
failure | fileds + src_ip, dest_ip, dest_port
Make sure your data sources have the right fields extracted in order to do the graph visualizations. Also note that you can only use two or three fields to be visualized with AfterGlow!
Note: This is for advanced users!
In order to change the behavior of the graph, you have to dive into AfterGlow by editing the AfterGlow configuration file. You can find the file in your $SPLUNK_HOME at: $SPLUNK_HOME/etc/apps/afterglow/afterglow/sample.properties. You find some information on the configuration file in the AfterGlow manual. More information you can extract from the README file inside of AfterGlow.
Let us know what specific questions you have around this and we'll be happy to help.
If you run into any problems, check your $SPLUNK_HOME/var/log/splunk/web_services.log file and find what exact command AfterGlow is running. Copy the command and execute it on the command line as follows:
echo a,b,c | "C:\Program Files\Splunk\etc\apps\afterglow\appserver\modules\AfterGlow\..\..\..\afterglow\afterglow.pl" -c "C:\Program Files\Splunk\etc\apps\afterglow\appserver\modules\AfterGlow\..\..\..\afterglow\sample.properties" -a -e 1.2 | D:\Graphviz\bin\neato.exe -Tgif -o "C:\Program Files\Splunk\etc\apps\afterglow\appserver\modules\AfterGlow\..\..\static\afterglow1364889675.59.gif" -Tcmapx -o "C:\Program Files\Splunk\etc\apps\afterglow\appserver\modules\AfterGlow\..\..\static\afterglow1364889675.59.map"
Obviously change the paths to what you see in your log file. Add the 'echo a,b,c |' part in front. Then see what errors come up or verify that the .map or the .gif files are in the corresponding paths. The warnings from Perl about define() statements are okay. This might give you clues as to what is wrong. If you cannot figure it out, please send us an extract from your log to help debug the issue.
For questions, comments, etc, please email us at: afterglow@secviz.org.
As a Splunkbase app developer, you will have access to all Splunk development resources and receive a 10GB license to build an app that will help solve use cases for customers all over the world. Splunkbase has 1000+ apps from Splunk, our partners and our community. Find an app for most any data source and user need, or simply create your own with help from our developer portal.