

You can analyze IMS Connect transaction performance data in Splunk using the IMS Connect transaction analysis Splunk application and the IMS Connect Extensions feed.
The IMS Connect transaction analysis application is an example application of leveraging transaction summary data provided by the IMS Connect Extensions feed. This fully functional application showcases how to analyze and interpret IMS Connect transactions, making it a valuable resource for developers looking to understand how to work with transaction data. By examining the data provided by the IMS Connect Extensions feed, the application demonstrates how to gain insights into transaction performance, identify potential bottlenecks, and optimize system performance.
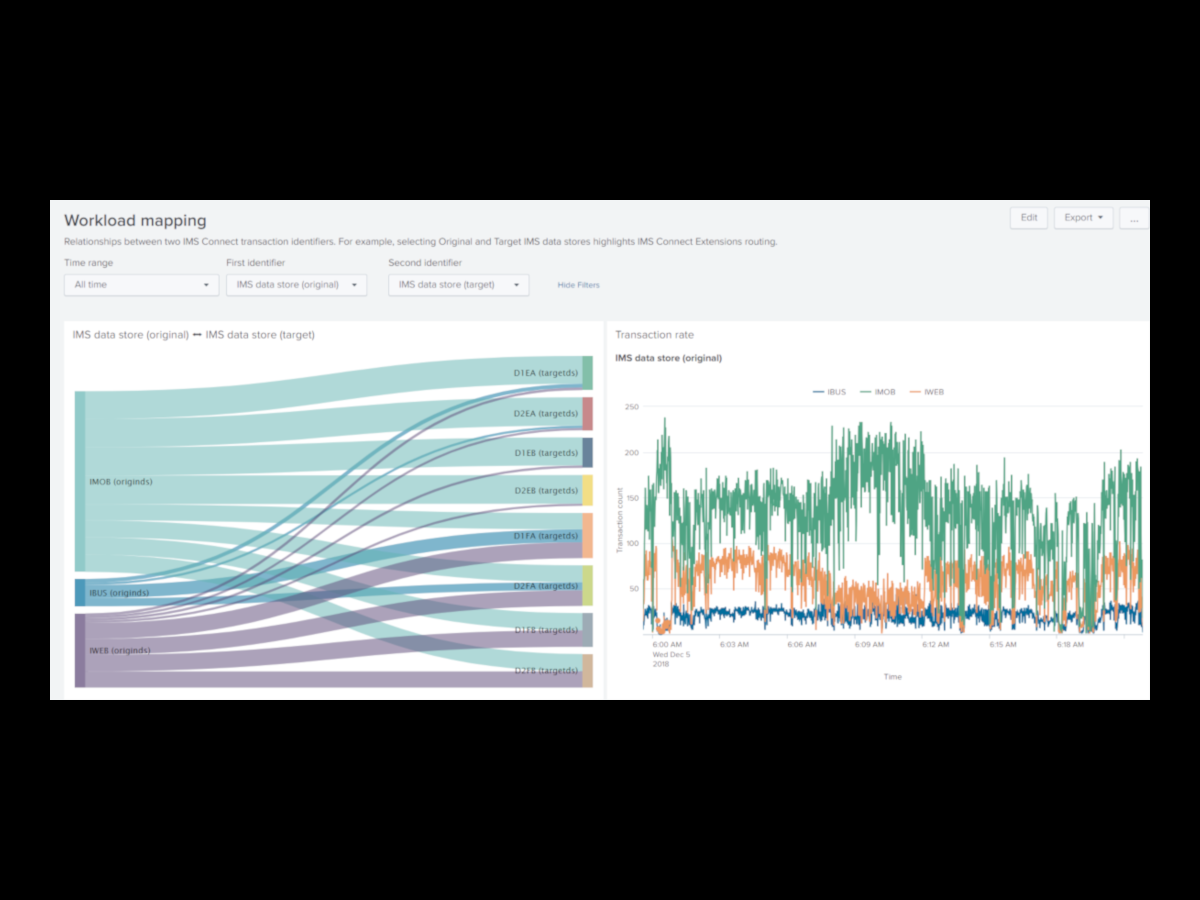
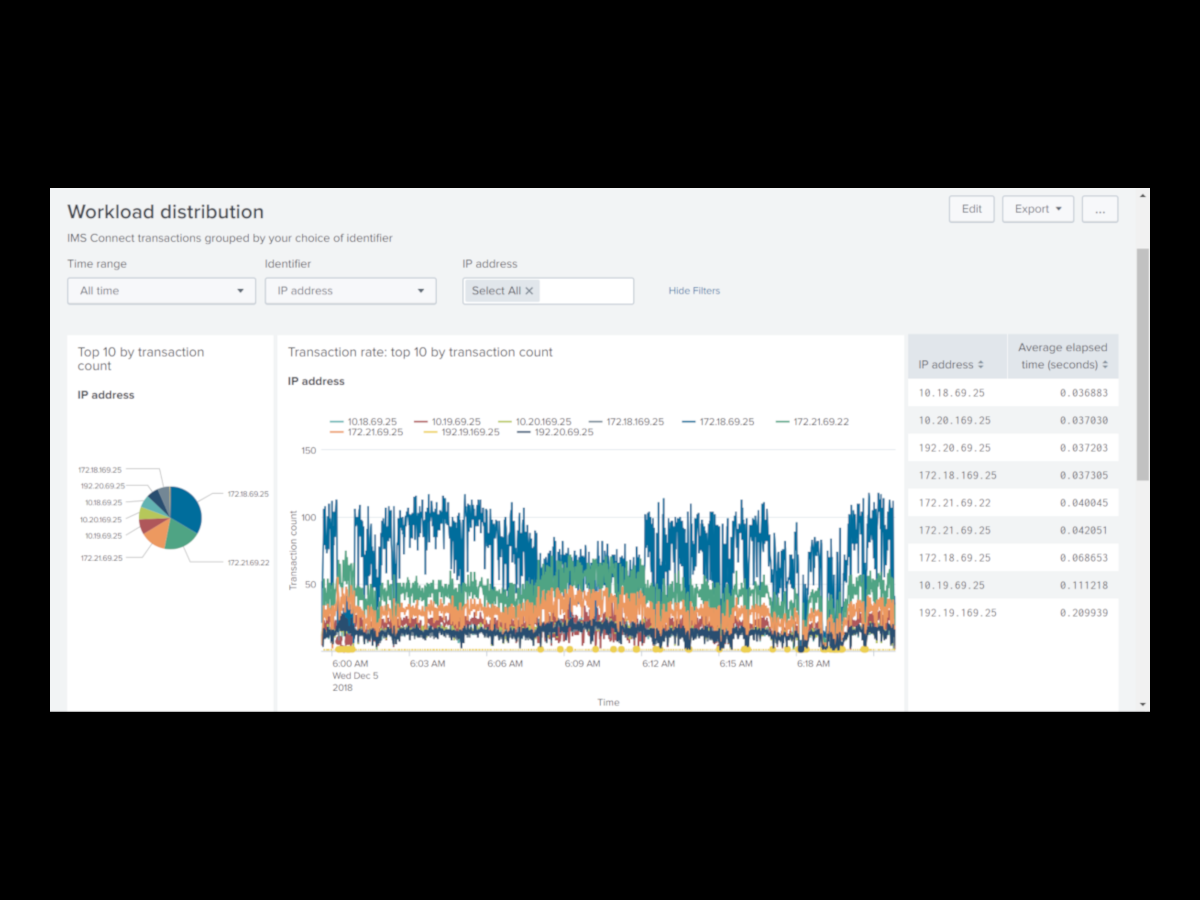
With this application, you can group the visualizations by various parameters such as IMS Connect system, transaction code, IMS data store (original or target), client ID, client IP address, IMS Connect port number, read exit, OTMA target member (tmember), tpipe, or User ID. These visualizations are beneficial to monitoring the health of IMS Connect, reporting on the effectiveness of IMS Connect Extensions OTMA workload routing, viewing the performance of a specific IMS data store or transaction code, and more. If you have configured a fallback routing system using IMS Connect Extensions, this application helps you observe how workload moves from the primary DATASTORE connection to the fallback. This way, you can optimize your IMS Connect system and ensure smooth functioning.
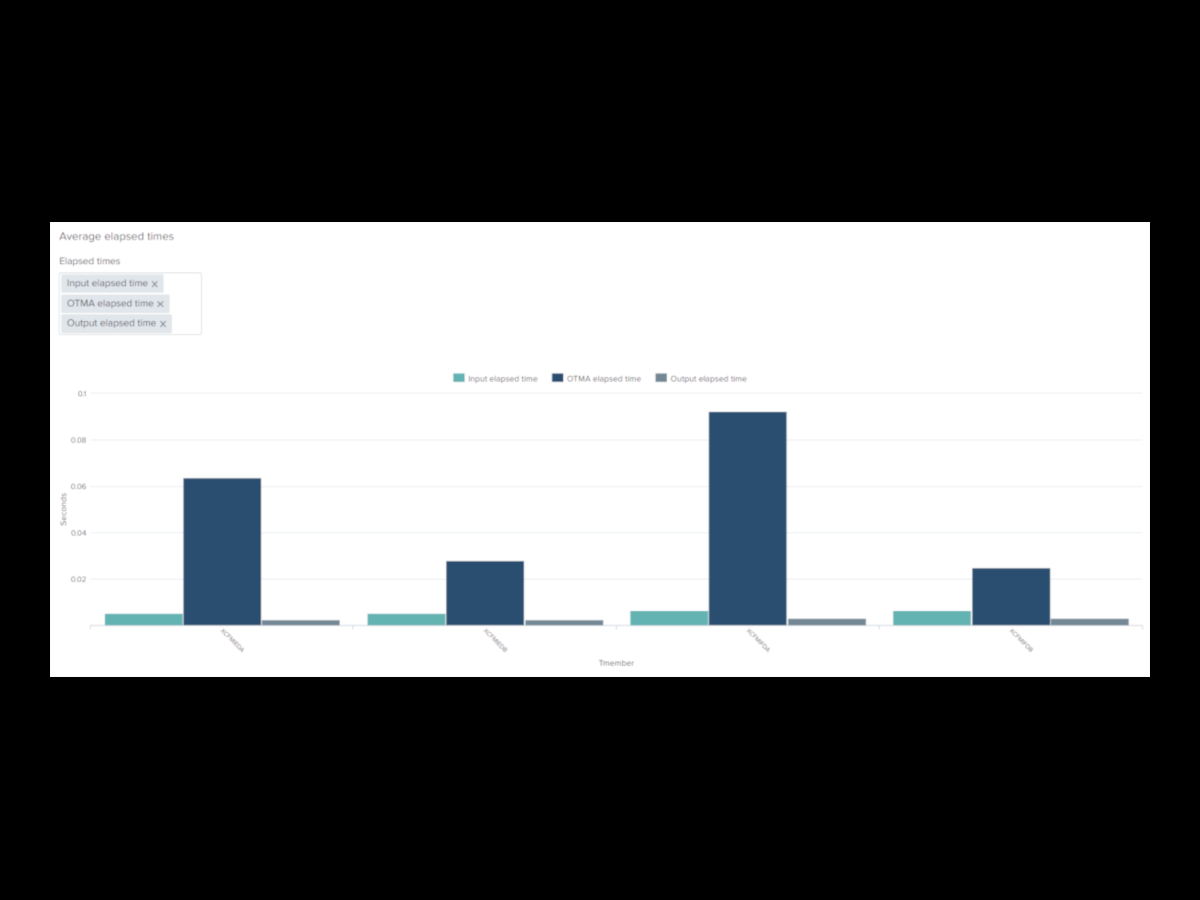
This application allows you to analyze several aspects of IMS Connect in detail. For instance, you can track transaction counts and response times, OTMA elapsed time, input and output elapsed times, SAF time, and workload distribution across IMS Connect systems to target IMS data stores. The data provided by this application can be used to identify bottlenecks and improve the overall performance of the IMS Connect system.
Using the IMS Connect transaction analysis application and the IMS Connect Extensions feed, you can easily monitor the performance of your IMS Connect system and take appropriate actions to maintain its efficiency.
Using IMS Connect Extensions PH55459, you can utilize the z/OS Connect token to link your IMS Connect performance data with other sources, including the z/OS Connect SMF123 record. To view the z/OS Connect token in the sample application, navigate to the Elapsed time components dashboard and scroll down to the IMS Connect transactions table.
The IMS Connect Extensions feed enables the collection of events from running IMS Connect systems. This feed consolidates the events into one record per IMS Connect transaction and then forwards those records to Splunk. The beauty of this tool is that Splunk developers can easily extend the IMS Connect transaction analysis application to incorporate new visualizations and additional metrics from the feed.
With the IMS Connect Extensions feed, developers can analyze the data, identify trends, and generate insights. You can also easily customize the application to meet your specific business needs. For a comprehensive understanding of the fields provided by the IMS Connect Extensions feed, you can refer to the IMS Connect Extensions feed fields on the topic of the IMS Connect Extensions for z/OS documentation.
| For more information | |
|---|---|
| Splunk Sankey Diagram - Custom Visualization | Splunk base |
| IMS Connect Extensions for z/OS v3.1 with PH55459 | Forwarding a live feed of IMS Connect events |
Fixed time spans for Elapsed time components
Dashboard visualizations now work as intended when using real-time windows.
Obtain Splunk AppInspect passed status.
Initial version.
As a Splunkbase app developer, you will have access to all Splunk development resources and receive a 10GB license to build an app that will help solve use cases for customers all over the world. Splunkbase has 1000+ apps from Splunk, our partners and our community. Find an app for most any data source and user need, or simply create your own with help from our developer portal.