
App for exploring and reporting on Web Proxy events
| Author | Aplura, LLC |
| App Version | 1.2.13 |
| App Build | 10 |
| Creates an index | False |
| Implements summarization | No |
| Summary Indexing | False |
| Data Model Acceleration | If Enabled |
| Data Model | Web |
| Report Acceleration | False |
| Splunk Enterprise versions | 9.2, 9.1, 9.0 |
| Platforms | Splunk Enterprise, Splunk Cloud |
This App provides the following scripts:
Diag.py
For use with the diag command.
version.py
For use with keeping track of the version number within Python scripts.
In many organizations, web proxies separate users from the Web at large. User web activity can often be a good indicator of possible compromise, phishing attempts, abuse, and outdated software. This app provides Splunk dashboards, forms, and reports which can be used to explore your web proxy events, and make sense of what can often be a large volume of data.
To do this, the app relies on the Splunk Common Information Model (CIM) for Web events. This means that the app can report on any web proxy data, as long as it has been on-boarded properly, and is available through the Web data model.
This app requires data model acceleration, which will use additional disk space. If you are using the Splunk App for Enterprise Security, this is already enabled, and should have been factored into your retention policies. If not, you should review the documentation on data model acceleration, how it uses disk space, and how to plan for it.
As mentioned above, the app uses the CIM for proxy events. The CIM allows you to take events from a number of sources or products, and report on them in one cohesive manner, using a common set of names for fields and event types.
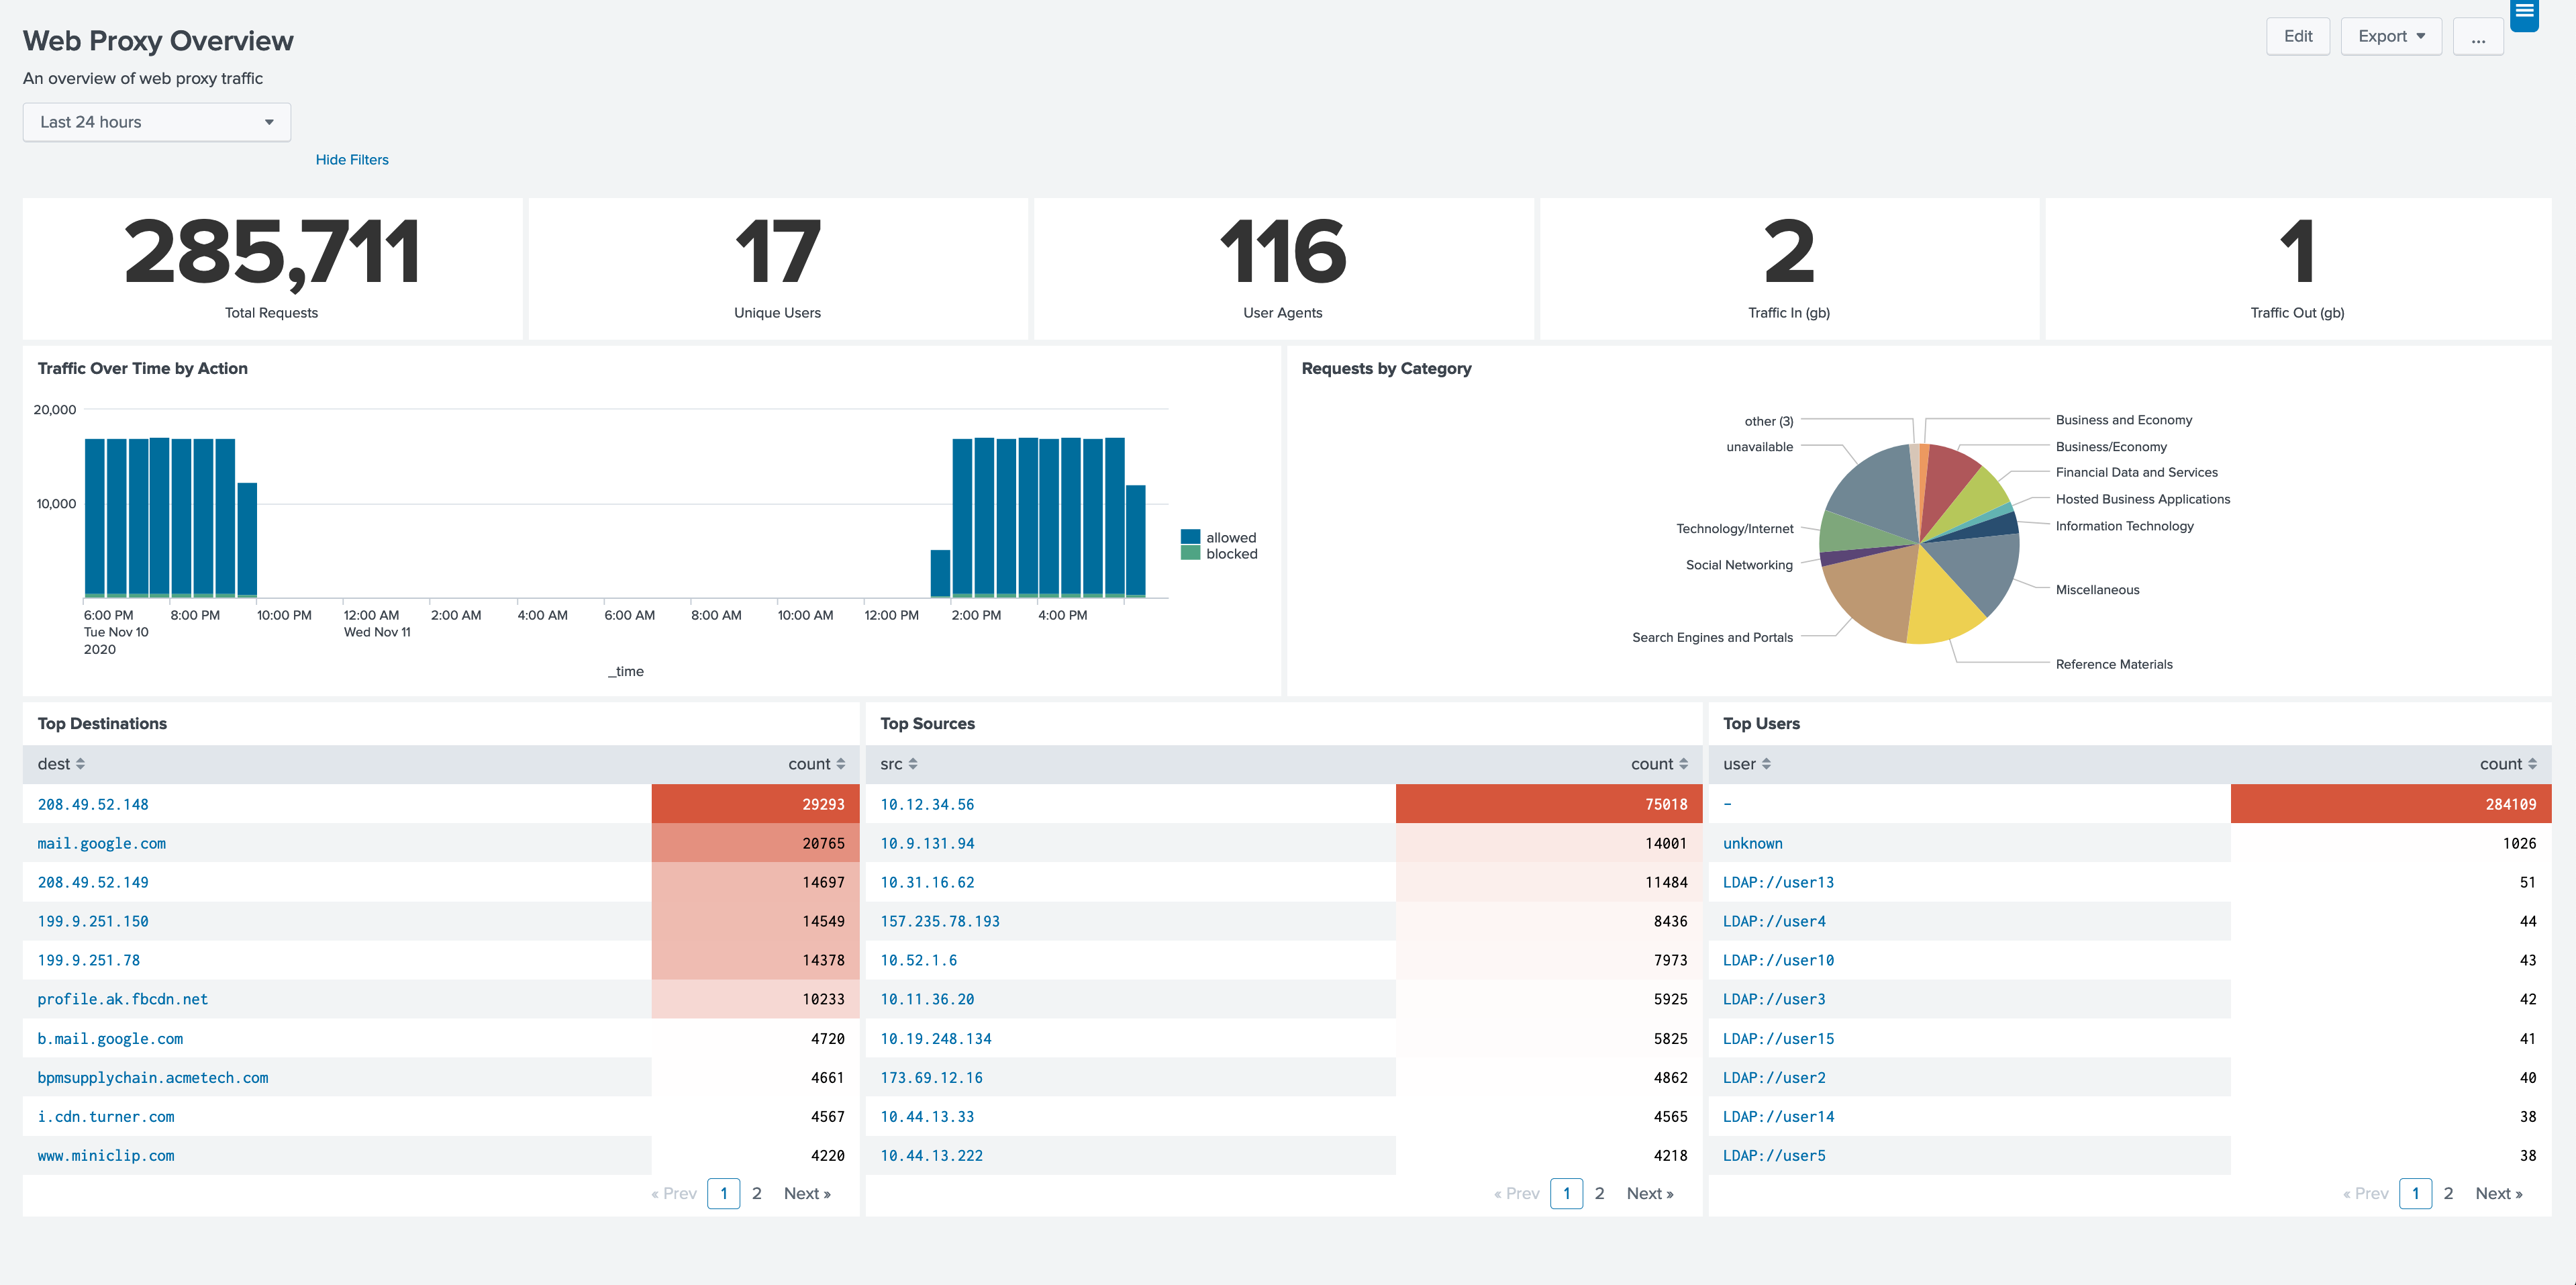
This dashboard serves as a jumping-off point for exploring your web proxy data. It includes panels for traffic over time, categories, top talkers, and users. Clicking on panels in this dashboard will drill down to the appropriate profile page for further exploration.
This form provides panels based on a users activity, including source IP addresses, category history, and destinations. By focusing on a particular user, you can see browsing activity, generate a report for HR, or see where a user may have become infected.
This form provides panels based on source IP addresses, often the users computer or servers. This includes activity over time, categories, users, user agents, and destinations. Use this form when you need to see what sites a particular IP has been visiting, which is useful if you find an un-authenticated session which is attempting to visit different sites.
This form provides panels based on a category. This includes requests over time, destinations, users, and sources. If particular categories are of concern for your organization, you can use this form to find users or systems which have visited the category.
This form provides panels based on destination, which may be a hostname or IP address. This includes URLs, categories, users, and sources. Using this form allows you to see what users visited a particular site, and which URLs are popular with your users. On sites which are categorized based on different URLs, you can see all the categories for visits to the destination. If you know of a compromised site (such as a watering hole attack), you can use this form to quickly find users and systems which may have visited it.
This dashboard shows users going to bad categories, showing the categories and user activity. Note that the selection of bad categories, which often changes from organization to organization, can be customized by following the steps in the section titled Customizing Categories for Policy Exceptions. Using this dashboard can highlight users which may be violating your organizations usage agreement or systems which may be compromised.
This dashboard provides analysis of the user-agent strings present in the web proxy events. To do this, the dashboard searches use a lookup which parses the user-agent strings. There are other lookups which perform this function, but TA-user-agents is used by default. For information on customizing the lookup being used, see the section titled Customizing user-agent lookups. Using this dashboard will help you find outdated or unauthorized browsers/software in your environment. Additionally, because some malware either modifies user-agent strings, or have their own, you may find compromised systems on your network.
This form provides an easy way to search proxy events for particular activity. If you already know what you are looking for, this form makes it easy to generate a search that return the events you need. Don’t forget that you can use the search icon at the bottom of the events panel to open the search in the Splunk search interface.
This dashboard provides panels to compare and contrast the activity of sourcetypes. Use the time-picker to display sourcetype activity over time and to visualize event counts by sourcetype.
A simple HTML version of this document.
PAVO Web Proxies App for Splunk contains the following lookup files.
apl_web_barracuda_wfa.csv
apl_web_bluecoat_wfa.csv
apl_web_checkpoint_wfa.csv
apl_web_cisco_wsa_wfa.csv
apl_web_mcafee_wg_wfa.csv
apl_web_palo_alto_wfa.csv
apl_web_urlblacklist_wfa.csv
apl_web_web_proxies_http_methods.csv
apl_web_websense_wfa.csv
PAVO Web Proxies App for Splunk does not include an event generator.
Summary Indexing: No
Data Model Acceleration: If Enabled
Report Acceleration: No
Bug
Improvement
Update titelin dashboards
Documentation and Rename
Initial Release
As a Splunkbase app developer, you will have access to all Splunk development resources and receive a 10GB license to build an app that will help solve use cases for customers all over the world. Splunkbase has 1000+ apps from Splunk, our partners and our community. Find an app for most any data source and user need, or simply create your own with help from our developer portal.