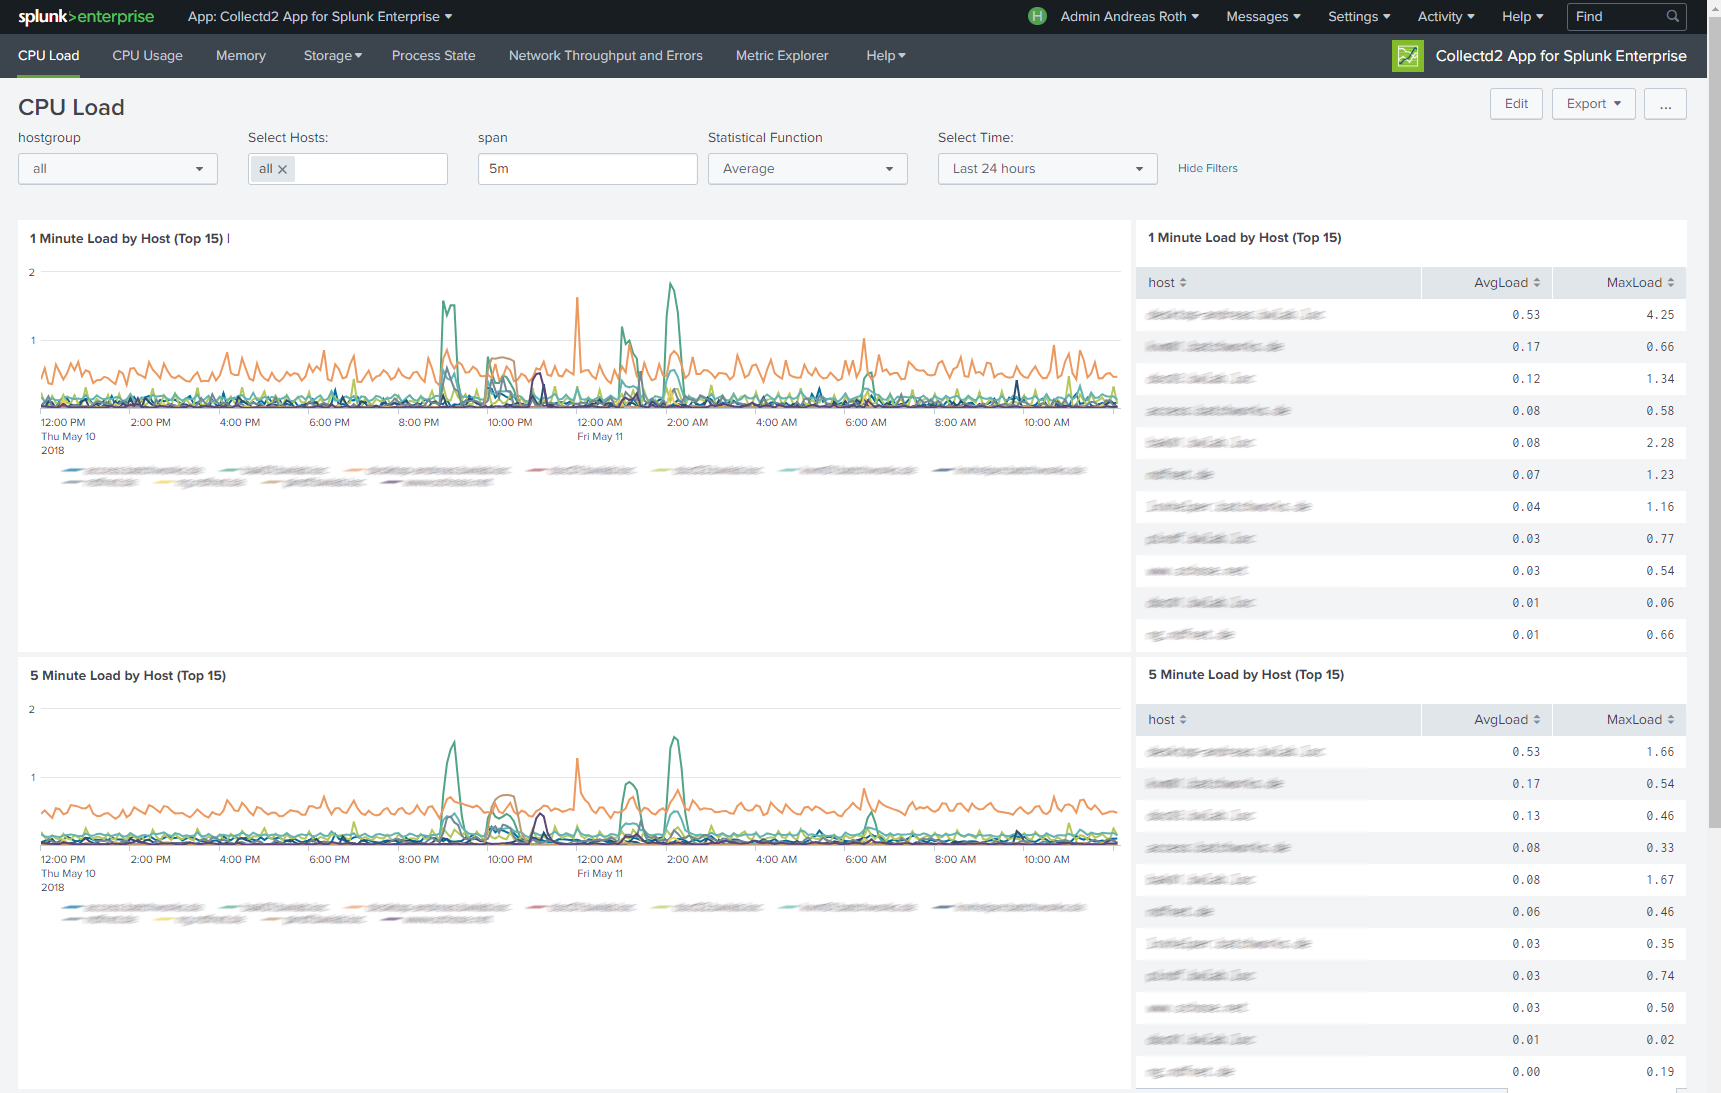
The "collectd2 App for Splunk Enterprise" analyzes your collectd metrics.
Those statistics can then be used to find current performance bottlenecks and predict future system load.
It uses the collectd daemon and http plugin on the client side and the Splunk HTTP Event Collector on the server side to gather data from client machines.
The application is a complete reimplementation of "collectd App for Splunk Enterprise by Nexinto GmbH" and is using Metric Indexes introduced in Splunk Enterprise 7.0.
Features:
Only Splunk Enterprise 7.1 is supported as the app useses metric index and enhanced mstats command. You will only need to deploy this app to your searchheads.
In your Splunk enviroment you need to have Splunk HTTP Event Collector (HEC) up and running. Here is a simple setup..
activate HEC in inputs.conf.
inputs.conf:
[http]
disabled=0
port=8088
enableSSL=0
dedicatedIoThreads=2
maxThreads = 0
maxSockets = 0
useDeploymentServer=0
Configure a HEC input with a token value. Make sure to configure the target index in index key. Ensure that sourcetype is set to collectd_http.
[http://collectd]
disabled = 0
sourcetype = collectd_http
token = d8d17157-a4d3-4bb2-1111-222222222222
index = collectd_metrics
indexes = collectd_metrics
Configure a metrics index in indexes.conf. Here its name is collectd_metrics.
[collectd_metrics]
datatype = metric
# keep data for 60 days
frozenTimePeriodInSecs = 5180000
coldPath = volume:colddb/collectd_metrics/
homePath = volume:hot/collectd_metrics/db
thawedPath = $SPLUNK_DB/collectd_metrics/thaweddb
repFactor = auto
Collectd has to be set up on every client machine. There is no universal forwarder needed on the client itself. Install collectd by using your distribution specific installer.
Debian/Ubuntu : apt-get install collectd -y
You need to load the following plugins: cpu, df, disk, interface, load, memory, processes, swap and write_http. Here is an example file for /etc/collectd/collectd.conf.
Make sure to adjust Host “targetfqdnhec” to your Splunk server providing the HEC input and replace the token according to your installation.
Hostname "myclient.fqdn.com"
FQDNLookup false
Interval 60

LoadPlugin syslog

<Plugin syslog>
        LogLevel info
</Plugin>

LoadPlugin cpu
<Plugin cpu>
  ReportByCpu true
</Plugin>
LoadPlugin df
LoadPlugin disk
LoadPlugin entropy
LoadPlugin interface
LoadPlugin irq
LoadPlugin load
<Plugin load>
    ReportRelative true
</Plugin>

LoadPlugin memory
<Plugin memory>
    ValuesAbsolute true
    ValuesPercentage true
</Plugin>

LoadPlugin processes
LoadPlugin swap
LoadPlugin syslog
LoadPlugin uptime
LoadPlugin users

LoadPlugin write_http
<Plugin write_http>
    <Node "node1">
        URL "https://targetfqdnhec/services/collector/raw"
        Header "Authorization: Splunk d8d17157-a4d3-4bb2-1111-222222222222"
        Format "JSON"
        VerifyPeer false
        VerifyHost false
        Metrics true
        StoreRates true
    </Node>
</Plugin>

LoadPlugin logfile
<Plugin logfile>
    LogLevel info
    File "/var/log/collectd.log"
    Timestamp true
    PrintSeverity false
</Plugin>
Collectd has to be set up on every client machine. There is no universal forwarder needed on the client itself. Install collectd by using your distribution specific installer.
RedHat6/Centos6: yum install collectd-5.2.2-1.el6.en.x86_64
RedHat7/Centos7: yum install collectd-5.4.2-1.el7.x86_64
Debian/Ubuntu : apt-get install collectd -y
You need to load the following plugins: cpu, df, disk, interface, load, memory, processes, swap and write_graphite. Here is an example file for /etc/collectd/collectd.conf.
Make sure to adjust Host "1.2.3.4" to your Splunk Server providing the TCP input.
Hostname "myclient.fqdn.com"
FQDNLookup false
Interval 300 # how often should performance data be gathered (here: every 5 minutes)
LoadPlugin syslog
<Plugin syslog>
LogLevel info
</Plugin>
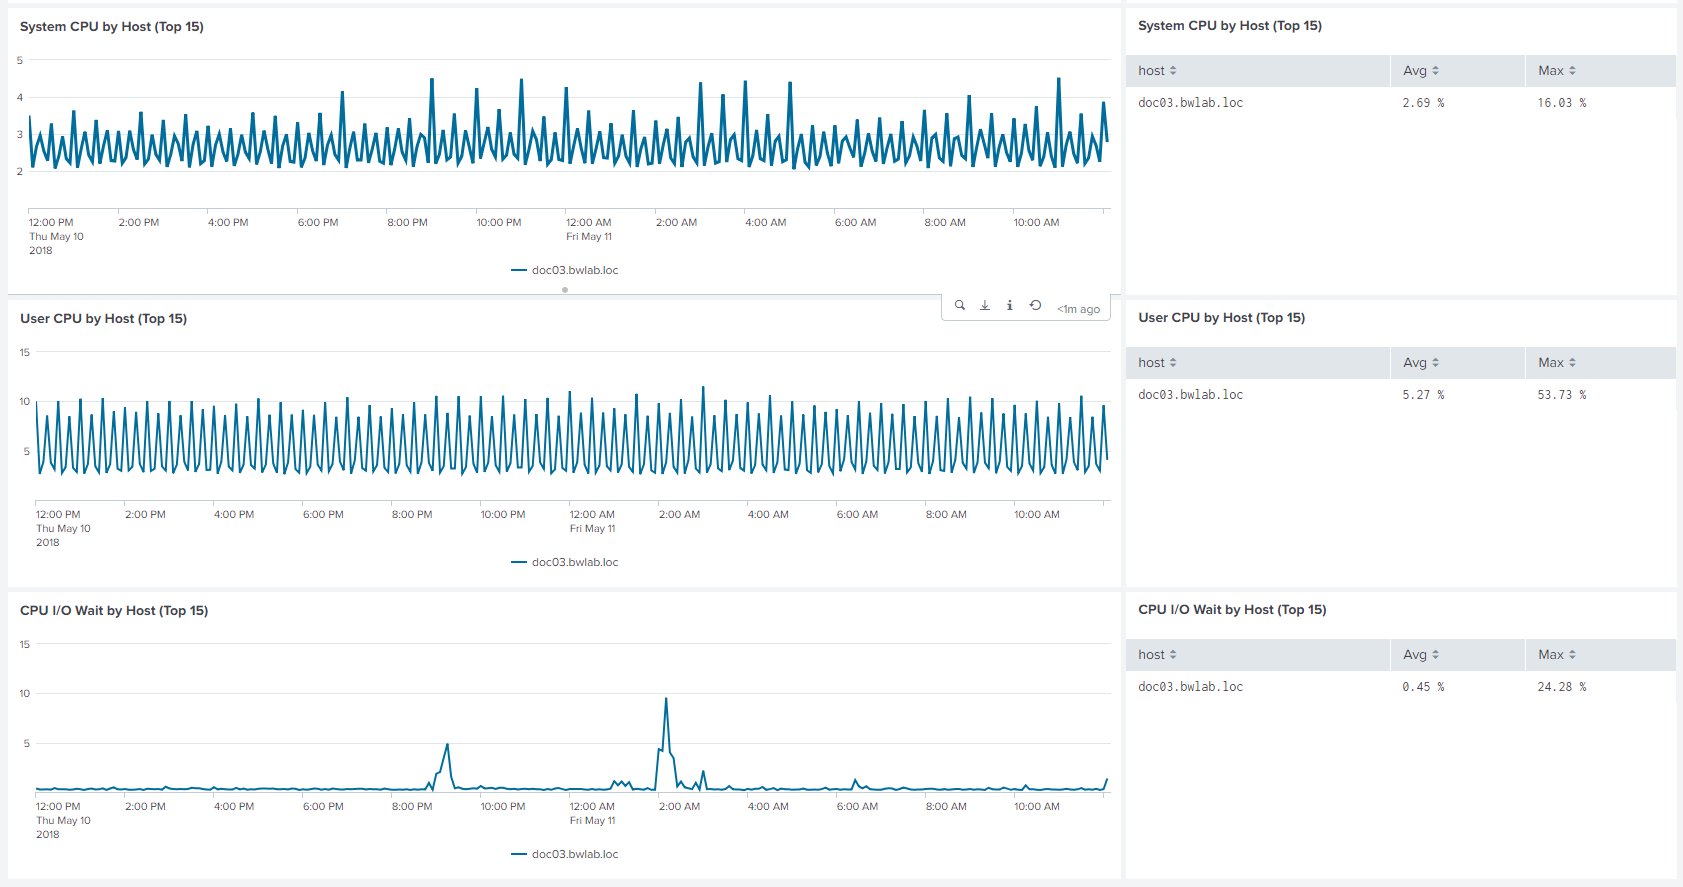
LoadPlugin cpu # needed for CPU dashboard
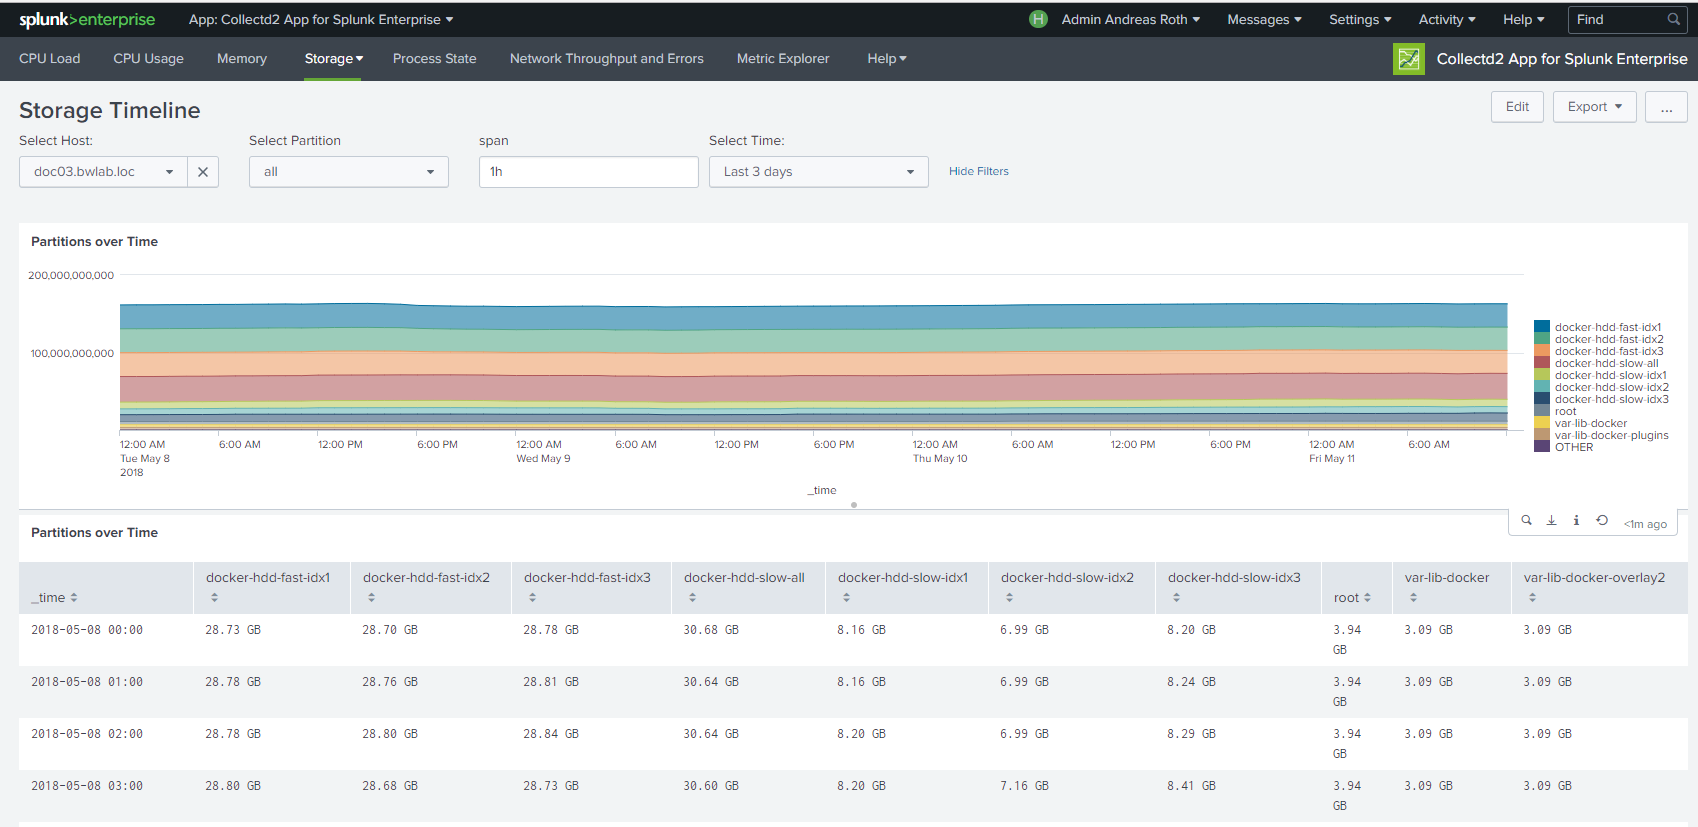
LoadPlugin df # needed for storage dashboards
LoadPlugin disk # needed for IO dashboard
LoadPlugin interface # needed for Network throughput dashboard
LoadPlugin load # needed for CPU Load dashboard
LoadPlugin memory # needed for Memory dashboard
LoadPlugin processes # needed for process state dashboard
LoadPlugin swap # needed for memory dashboard
LoadPlugin write_graphite # needed for writing data to TCP port
<Plugin write_graphite>
<Carbon>
Host "1.2.3.4" # here goes the splunk indexer / tcp input
Port "10001"
Protocol "tcp"
</Carbon>
</Plugin>
With a reference enviroment we determined a license need of 61MB/host/day when you have an interval of 60 seconds. When you go down to a 5 minutes interval you will need 20% so 12MB/host/day.
License needs increased about 240% compared to version1 of the app as Splunk charges 150bytes for every delivered metric.
As a reminder: the collectd graphite data had an average length of ~65 bytes.
The client name is determined from collectd.conf hostname entry. Please ensure the hostname is set correctly.
You can assign hosts to self-configured hostgroups. These hostgroups are used for an inital grouping in the dashboards. A host can be assigned to multiple hostgroups.
You create and edit hostgroups in the lookups/hostgroups.csv file.
In this example there are 5 hostgroups. The default group "all" contains all hosts. Production contains hosts with "prd" prefix. EC2 instances are prefixed by "ip-".
hostgroup,hosts
all,"*"
Production,"prd*"
Integration,"int*"
Development,"dev*"
EC2instances,"ip-*"
At the moment you can only use "*" as a wildcard for the hostname - no comma seperated list for multiple entries.
Navigation is the same for every dashboard. In default view every host will be shown. For fast comparison of multiple hosts you can use the "Hosts" dropdown.
Hostgroups will help you when searching and comparing large amount of hosts.
If you have feedback, issues or questions please use issue tracker at Github page: https://github.com/schose/collectd2.
For direct feedback please contact: andreas@batchworks.de or splunkapps@nexinto.com.
This app was created by:
Batchworks
Charlottenstrasse 38
01099 Dresden
Telefon: +49 36202-714901
E-Mail: andreas@batchworks.de
Internet: www.batchworks.de
Nexinto GmbH
Nagelsweg 33-35
20097 Hamburg
Telefon: +49 40-77175-0
Telefax: +49 40-77175-519
E-Mail: ITSolutions@nexinto.com
Internet: www.nexinto.com
As a Splunkbase app developer, you will have access to all Splunk development resources and receive a 10GB license to build an app that will help solve use cases for customers all over the world. Splunkbase has 1000+ apps from Splunk, our partners and our community. Find an app for most any data source and user need, or simply create your own with help from our developer portal.