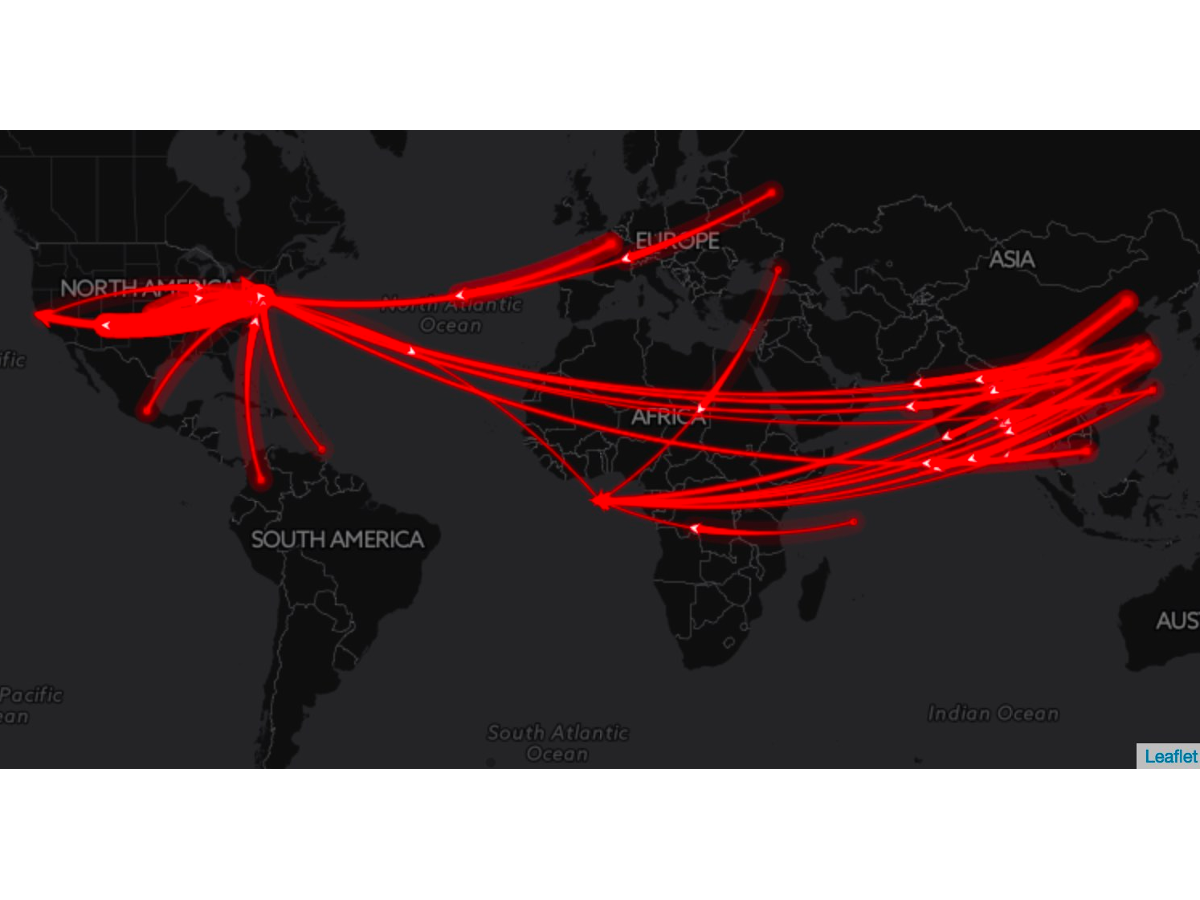
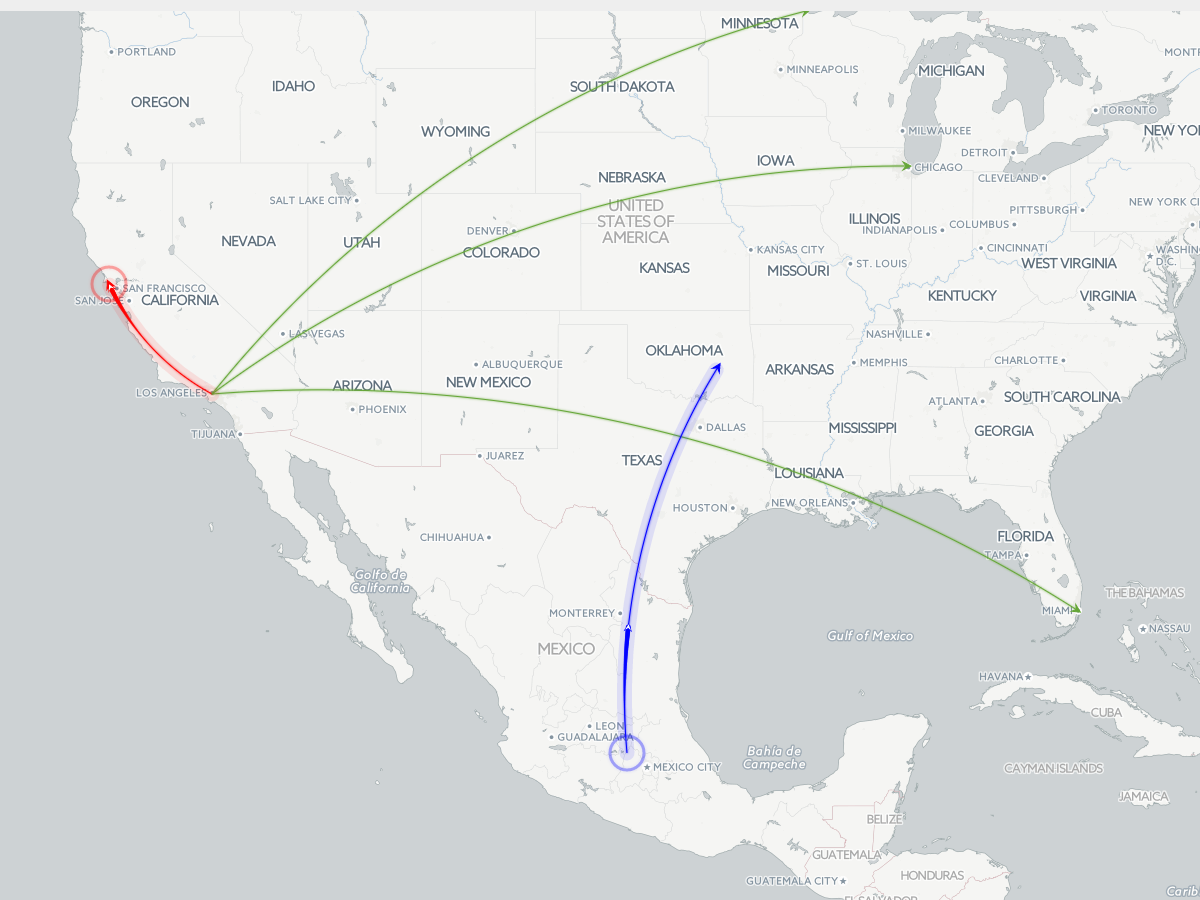
This visualisation will show connected arcs on a map. Each arc is defined by two geographic points, and can have a color assigned. Additionally the arcs can be animated, with the pulsing animation being either at the start or the end of the arc.
Globally, the arc thickness, default color and map tileset can be chosen, as well as the starting map position and zoom.
This visualisation is based upon leaflet.migrationLayer by react-map: https://github.com/react-map/leaflet.migrationLayer
Some use cases could be:
Note: If any lines are animated this will result in heightened browser CPU usage.
The visualisation looks for fields of the following names:
The fields must be named in this way, but they are not order dependent.
An example dataset is distributed as a lookup to experiment with.
| inputlookup missilemap_testdata
The following options are available to customise:
This visualisation was developed at Tesserent.
http://www.tesserent.com
support@rivium.com.au
LeafletJS: http://leafletjs.com/
Used under BSD license (https://github.com/Leaflet/Leaflet/blob/master/LICENSE)
leaflet.migrationLayer: https://github.com/react-map/leaflet.migrationLayer
Used under MIT license (https://github.com/react-map/leaflet.migrationLayer/blob/master/LICENSE)
Added app.manifest to prevent installations on index layer of Splunk Cloud
Upgraded jQuery to 3.6.0 and other libraries
Splunk cloud compatibility update
Added scrollWheelZoom to the XML options (not visible in web UI)
Fixed transposed latitude/longitude fields
1.0: Initial release
As a Splunkbase app developer, you will have access to all Splunk development resources and receive a 10GB license to build an app that will help solve use cases for customers all over the world. Splunkbase has 1000+ apps from Splunk, our partners and our community. Find an app for most any data source and user need, or simply create your own with help from our developer portal.