
INTRODUCTION
SF-Sherlock Smart Mainframe Monitoring for Splunk is specifically designed to provide a clear picture of your z/OS mainframes in real-time through the Splunk Enterprise platform. This Splunk app focuses on security as well as operational intelligence and visualization of critical mainframe infrastructure.
SIEM physics is simple: no input, no output.
Therefore SF-Sherlock differs from regular mainframe connectors available for Splunk by also providing integrity protection for z/OS. As the highly recognized 360 z/OS monitoring solution, supporting RACF, CA-TSS and CA-ACF2, SF-Sherlock comes into play when critical mainframe infrastructure requires both real-time event monitoring as well as vulnerability assessment and audit trail protection. SF-Sherlock covers all aspects of monitoring, such as security, compliance, fraud detection, auditing and operational issues. It also protects your systems in real time against critical scenarios, such as breaking the audit trail, suppressing or manipulating audit data, malicious code, security system bypassing, and other exploits. SF-Sherlock represents a highly comprehensive “z/OS SIEM & Big Data connector” for mission-critical mainframes.
Without such comprehensive audit trail protection and vulnerability scanning, a professionally performed z/OS attack would most likely result in your SIEM becoming "improperly fed," and all your smart correlations would simply be bypassed. Definitely not a SIEM success story for critical infrastructure!
As a next-generation mainframe SIEM, this Splunk app finally enables you to gain reliable real-time visibility and reporting around all security and operational issues on z/OS.
=====================================================================================
COMPREHENSIVE MAINFRAME MONITORING WITH SPLUNK
In cooperation with Splunk, SF-Sherlock
• collects all required mainframe events in real-time, such as SMF records, the SYSLOGs, JES spool output, application and server log files in the z/OS and USS environments, and much more
• allows plug&play mainframe log analysis by supporting all standard logs and formats as well as installation-defined log types
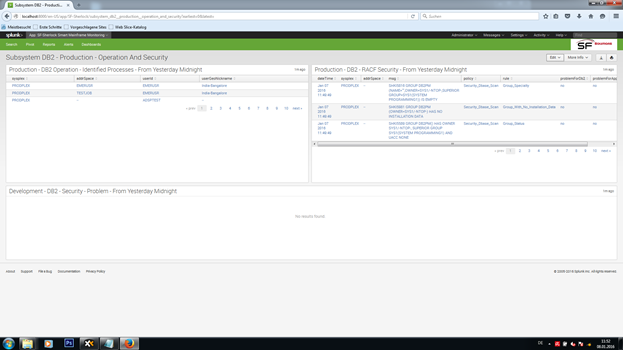
• takes data from all subsystems of your mainframes, including, but not limited to z/OS, USS, DB2, CICS, IMS, JES, MQ, TCP/IP, VTAM, WebSphere, Crypto, and much more
• performs constant security as well as operational assessments to report on vulnerabilities, weaknesses, operational risks (e.g. detected by its IPL simulation), configuration details, anomalies, and much more
• significantly lowers your mainframes' risks in connection with security and operation by offering early problem detection and forecasting
• securely forwards this data to Splunk Enterprise for real-time analysis and intelligence
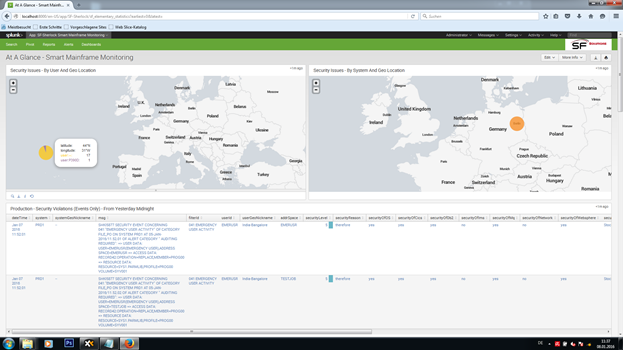
• allows you to correlate both operational and security data from all your mainframes with events occurring on other platforms
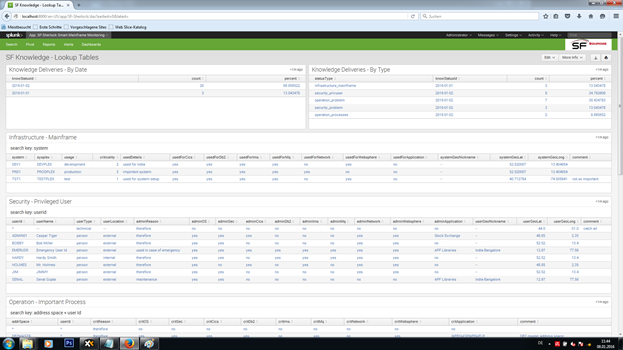
• keeps your SIEM updated at all times on all mainframe configuration-related details, enabling you to identify more significant correlations (e.g. lists of all critical system libraries, administrators, and much more)
• protects your mainframe systems, alerts you to any attacks, and optionally initiates countermeasures; this is not limited to MVS, but also includes USS, DB2, and others
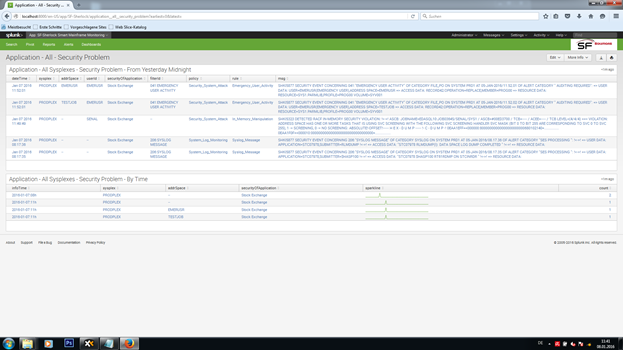
• creates a broad spectrum of best-practice reports and dashboards for all parties involved
• supports several reliable methods to transfer SF-Sherlock’s event and assessment data into Splunk (file, TCP, UDP etc.)
Please note that installing this Splunk app requires SF-Sherlock running on your z/OS mainframe. SF-Sherlock and this app are easy to install. Just use this app, in combination with the “SF-Sherlock 2 Splunk” connector which is part of the SF-Sherlock standard software package, to store, analyze and alert you to mainframe-related events within Splunk.
If you have any questions or problems please do not hesitate to contact us.
=====================================================================================
INSTALLATION PROCEDURE:
Installing this app is easy and requires just two steps:
A) Install this Splunk app and validate its installation via the included test data.
B) Enable the "SF-Sherlock 2 Splunk" connection on your mainframe.
That's all.
So, let's start.
A) Installation steps within Splunk:
A1) Download the app by asking our technical support team for a download link.
A2) Import the app within Splunk.
A3) The sampleData sub directory within the app's directory includes some sample knowledge data as well as assessment and event data for testing:
Note: If you don't change the "^dateTime=xxx yy 2016" timestamp, the test data will be out of the dashboards' scope of time, and you won't see anything.
A4) Perform a quick app test by adding the test data to Splunk:
A5) Establish a TCP- or UDP-based data import within Splunk for "feeding" Splunk with mainframe events in real-time. Select the proper port and provide the Splunk server's IP address and port number to your mainframe system programmer who is responsible for the SF-Sherlock installation. SF-Sherlock's standard software delivery includes test jobs for sending test data to Splunk.
A6) In order to effectively set up your Splunk app, you will have to ask your mainframe system programmer for the following details about your company's mainframe infrastructure:
And don't worry, some of this information will be generated automatically by SF-Sherlock.
B) Installation steps within SF-Sherlock:
B1) Install the "SF-Sherlock 2 Splunk" connection kit provided with the SHERLOCK.SSHKSAMP file. It includes the UMODSK01 and UMODSK02 SMP/E user modifications.
B2) Enter the Splunk server connection details (IP address and port) in the SPLUNKSE init-deck member.
B3) Test the "SF-Sherlock 2 Splunk" connection "offline" first, i.e. outside of the SF-Sherlock started procedures' runtime context. You can easily do this using the SPLNKTST batch job.
B4) When everything is working fine, simply update the xxx.SHRLCK.SSHKLOAD runtime load library by copying the two modules SPLNKAPI and SPLNKSHR (don't copy the entire target library).
B5) Update the SPLUNK00 and SPLUNK01 init-deck members, which select the spectrum of event and assessment data that will be sent to Splunk. Furthermore, enable both members within the $BUILD00 init-deck member via corresponding ADD statements.
B6) Refresh or recycle the SHER-MONITOR started procedure.
Congratulations! SF-Sherlock will now send its data to Splunk.
=====================================================================================
IMPORTANT SECURITY AND COMPLIANCE ISSUES WHEN CONNECTING YOUR MAINFRAMES TO SPLUNK:
In order not to violate your company's data protection and privacy policies, or even legal requirements, please review the following:
1) Decide explicitly which information will be sent from your mainframe to Splunk:
2) How long will this data be stored in Splunk?
3) The assessment-related information is most sensitive. Who may access this data within Splunk? Who gets reports? Who will have administrator rights within Splunk, or be authorized to access this information? Does Splunk protect this information in accordance with the mainframe access regulations?
4) Which kinds of correlations are intended? Are they allowed?
It's smart to clarify that in advance.
=====================================================================================
KNOWLEDGE MAINTENANCE
The knowledge provided to the Splunk app allows for a highly precise classification of all mainframe event and assessment data that was delivered from SF-Sherlock in real-time. Proper knowledge implementation and maintenance is key to successful correlation within your mainframe infrastructure. Splunk is the champions league solution to identifying everything and anything via deep data analyses. So, it's worth investing some time to set up the knowledge properly. No worries, it's easy.
Note: Implementing the knowledge in form of a log file allows you to create and deliver the knowledge from any external source. In the beginning, it's best to work manually with a "master file" that is set up by using the provided template.
=====================================================================================
Legal Notes:
CA, CA-ACF2, CA-TSS and CA-Top Secret are trademarks of Computer Associates International, Inc.; CICS, DB2, IBM, IMS, MVS, MQ, MQSeries, MVS, RACF, TWS, USS, VTAM, WebSphere and z/OS are trademarks of IBM; SF-Sherlock is a trademark of Dr. Stephen Fedtke, Enterprise-IT-Security.com.
As a Splunkbase app developer, you will have access to all Splunk development resources and receive a 10GB license to build an app that will help solve use cases for customers all over the world. Splunkbase has 1000+ apps from Splunk, our partners and our community. Find an app for most any data source and user need, or simply create your own with help from our developer portal.