
collectd App for Splunk Enterprise by Nexinto
Overview
The "collectd App for Splunk Enterprise" analyzes your OS performance and storage data.
Those statistics can then be used to find current performance bottlenecks and predict future system load. It uses the collectd daemon and the graphite plugin to gather data from client machines.
Features:
Analyze System Load
Analyze CPU Usage (overall and per core)
Memory Usage (used, cached, buffered, swapped, free memory)
Storage Trending (in-/decrease per host and per partition)
Storage Timeline (Host and Partition usage over time)
Storage Performance (IOPs, Latency, Volume) by Host and Partition
Process State (running, sleeping, blocked and zombie processes) over time
Network Throughput and Errors (Packets/s) by Host and Interface
Installation
Deploy the “collectd App for Splunk Enterprise” like every other app by uploading the App using the WebGUI or extracting it to $SPLUNK_HOME$/etc/apps. In a distributed environment the app has to be deployed to every Search head and Indexer. Besides collectd there is no additional Universal Forwarder installation needed on the client side.
With default settings the app will create an index "collectd"" and a TCP input on port 10001. You can customize these settings by changing the TCP port in inputs.conf.
If you use multiple indexes or want to use a different than the "collectd"" index adjust the section "collectd_index" in macros.conf using the local directory.
macros.conf
[collectd_index]
definition = index=MYCUSTOMINDEX
iseval = 0
collectd Configuration for Linux
Collectd has to be set up on every client machine. There is no universal forwarder needed on the client itself. Install collectd by using your distribution specific installer.
RedHat6/Centos6: yum install collectd-5.2.2-1.el6.en.x86_64
RedHat7/Centos7: yum install collectd-5.4.2-1.el7.x86_64
Debian/Ubuntu : apt-get install collectd -y
You need to load the following plugins: cpu, df, disk, interface, load, memory, processes, swap and write_graphite. Here is an example file for /etc/collectd/collectd.conf. Make sure to adjust Host “1.2.3.4” to your Splunk Server providing the TCP input.
Hostname "myclient.fqdn.com"
FQDNLookup false
Interval 300                # how often should performance data be gathered (here: every 5 minutes)
LoadPlugin syslog
<Plugin syslog>
        LogLevel info
</Plugin>
LoadPlugin cpu              # needed for CPU dashboard
LoadPlugin df               # needed for storage dashboards
LoadPlugin disk             # needed for IO dashboard
LoadPlugin interface        # needed for Network throughput dashboard
LoadPlugin load             # needed for CPU Load dashboard
LoadPlugin memory           # needed for Memory dashboard
LoadPlugin processes        # needed for process state dashboard
LoadPlugin swap             # needed for memory dashboard
LoadPlugin write_graphite   # needed for writing data to TCP port
<Plugin write_graphite>
  <Carbon>
    Host "1.2.3.4"          # here goes the splunk indexer / tcp input
    Port "10001"
    Protocol "tcp"
  </Carbon>
</Plugin>
Data Volume
Collectd data is really compact. We measured about 3-6MB data usage per client – varies most on system parameters like partion count, size and memory. You will be able to monitor about 100 hosts with the free 500MB/d license.
Client names and deployment modes
By default the "collectd App for Splunk Enterprise" assumes that your reverse DNS is working correctly and will determine the hostnames this way. If this does not work for your environment, you can extract the hostnames from the collectd event itself. So there are 4 different deployment scenarios:
Hostnames are determined from reverse DNS resolution: This is default behavior. No change needed.
Hostnames have to be determined from the event ifself: create a "local" dir and copy and rename props.conf.extracthostnames and transforms.conf.extracthostnames to the local dir.
collectd hostnames are vice-versa FQDNs: If you are already using collectd and Graphite you just need to define another TCP source in collectd.conf. It's a quite typically configuration that you reverse your hostname in collectd.conf for displaying purpose (myclient.mydomain.com is written as Hostname "com.mydomain.myclient" in collectd.conf). If you using this configuration and you have to determine client names from the event instead of reverse DNS use examples\transforms.conf.extracthost-vice-versa. Here the hostname is rewritten on the fly at indexing time.
use Universal Forwarder on the Client: If you want to use enhanced Forwarder Features features like encryption, load-balancing, traffic routing or buffering you could use Universal Forwarder on the client itself. Create a local TCP input on the client using a inputs.conf and adjust collectd.conf to log to localhost.
inputs.conf:
[tcp://5000]
connection_host = none
host = myhost01.mydomain.com
index = collectd
source = collectd
sourcetype = collectd
collectd.conf:
<Plugin write_graphite>
<Carbon>
Host "127.0.0.1" # log to the localhost
Port "5000"
Protocol "tcp"
</Carbon>
</Plugin>
Dashboard documentation
Navigation is the same for every dashboard. In default view every hosts will be shown. For fast comparison of multiple hosts you can use the Hosts dropdown. The ""environment"" is the last value of the FQDN for the host, meaning “example1.com” for web.example1.com and “example2.com” for db.example2.com. This will help you when searching and comparing large amount of hosts.
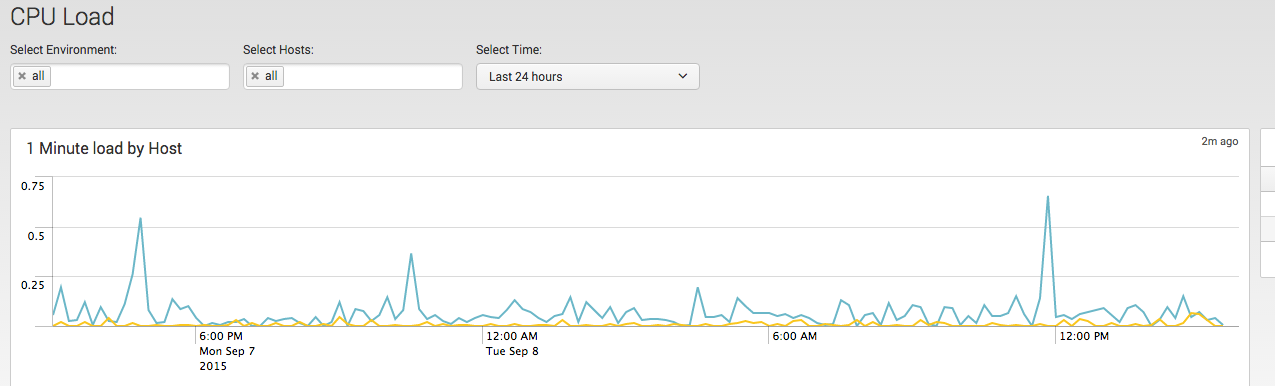
CPU Load: Displays average and max load of systems for the defined timeframe (default 24h)
CPU Usage: Displays average and max cpu usage by host. By select Object you can drilldown to every system core
Memory: Average and max values for used, free, cached and swapped memory is displayed on host basis
Storage Trends: Storage increase by hosts in GB will show storage usage on a host in the defined timeframe. Notice that it will only display hosts and partition where a storage in-/decrease occurs. If you have a partition which is not changing for any kind of reason the Table Storage changes by partition will not display this partition.
Storage Timeline: the storage timeline will display a timechart for a host (default with all partitions) and a table displaying the usage on a per day basis. This will help you to see the sum of all usage and which partition is in-/decreasing most.
Process state: amount of concurrently running/sleeping/zombie processes and their ratio is displayed.
Network Throughput and Errors: Additionally to the host you are able to select a dedicated network interface on the host. If there are no errors for any interface on the hosts the last panel “error sum by host and interface” will be empty
Feedback
If you have Feedback, issues or questions please use issue tracker at Github page: https://github.com/Nexinto/collectd . For direct Feedback please contact: splunkapps@nexinto.com.
This app was created by:
Nexinto GmbH
Nagelsweg 33-35
20097 Hamburg
Telefon: +49 40-77175-0
Telefax: +49 40-77175-519
E-Mail: splunkapps@nexinto.com
Internet: www.nexinto.com
As a Splunkbase app developer, you will have access to all Splunk development resources and receive a 10GB license to build an app that will help solve use cases for customers all over the world. Splunkbase has 1000+ apps from Splunk, our partners and our community. Find an app for most any data source and user need, or simply create your own with help from our developer portal.