

There is a documentation tab in the navigation bar of the app. This documentation pages goes over the methods that are used and what kind of data they will accept.
The gist of this app is just a wrapper to send data from Splunk into a d3plus.viz element. You can read more about d3plus here.
Additionally, there is a tutorial of sorts under 'App information' in the app as well. Lastly, if you're still having trouble understanding how to integrate these visualizations, it would be best to also consult the Splunk 6.x Dashboard Examples App as well as the Custom Visualizations App.
Just changed some 6.2 references to 6.3. Nothing else.
Added a new data option: is_numeric. This allows you to convert any number of fields into integers in order to visualize.
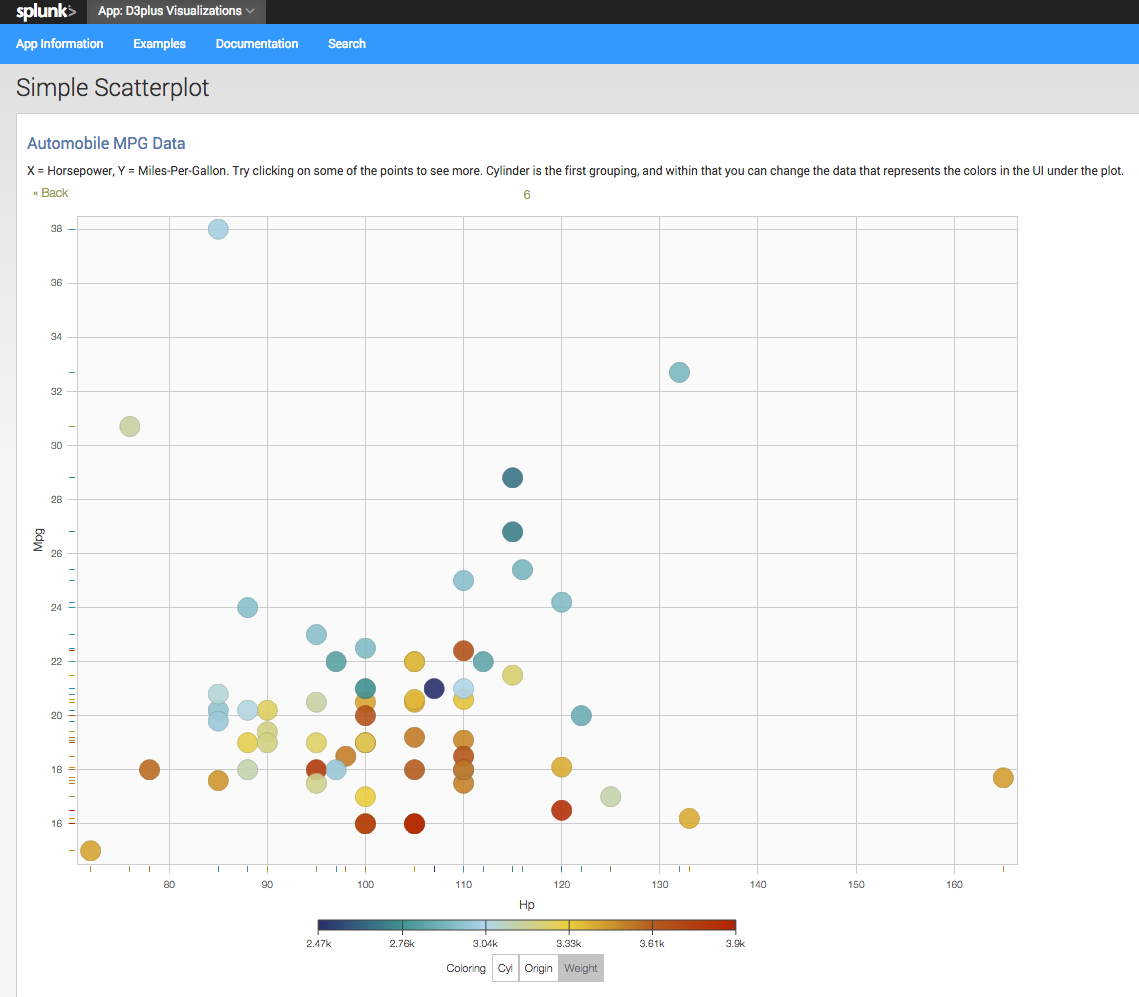
D3plus (d3plus.org) is a simplified extension to d3.js (d3js.org) that makes visualizing data easier - this app has examples for adding various visualizations:
Some of the searches are based on the internal index as well as the audit index. If you don't have access to those, try changing the search.
Additionally, all the css & javascript needed is exposed. You can raise issues or submit bugs at http://github.com/metasyn/splunk_d3plus/issues . Lastly, there is documentation inside the app.
D3plus (d3plus.org) is a simplified extension to d3.js (d3js.org) that makes visualizing data easier - this app has examples for adding various visualizations:
Additionally, all the css & javascript needed is exposed. You can raise issues or submit bugs at http://github.com/metasyn/splunk_d3plus/issues . Lastly, there is documentation inside the app.
As a Splunkbase app developer, you will have access to all Splunk development resources and receive a 10GB license to build an app that will help solve use cases for customers all over the world. Splunkbase has 1000+ apps from Splunk, our partners and our community. Find an app for most any data source and user need, or simply create your own with help from our developer portal.