
Important note: This app only contains dashboards and reports. No data is collected by this app. For Capture Engine data collection, install and configure the separate TA-Savvius-nix or TA-Savvius-win technology add-on.
The LiveAction for Splunk App is a long term monitoring and reporting solution for LiveAction LiveWire. With the LiveAction for Splunk App, many different kinds of network and application statistics and hundreds of different types of events events from one or more Capture Engines can be viewed in dashboards as an aggregated set or individually. Within the dashboards, any range of time can be chosen, and statistics and events from different times can be compared.
Although we believe the dashboards provided are useful, we look at them as a starting point, and users are encouraged to customize, enhance, and clone the dashboards to create their own. The wealth of statistics and events from Capture Engines can also be correlated with other data in completely different dashboards. This is when the insight happens about how the network affects other aspects of the business, and vice versa.
The LiveAction for Splunk App does require a physical of virtual LiveWire server.
The LiveAction for Splunk App builds on the ability of the Capture Engine to output events and statistics as CSV files at specified intervals, and have them ingested into a Splunk Server. The LiveAction for Splunk solution consists of a Capture Engine and a Splunk Server.
On the machine running the capture engine there is a Splunk Forwarder and a Savvius Technology Add-on (TA). The Splunk Forwarder is a utility available for Windows and Linux that is offered for free by Splunk. The Splunk Forwarder forwards data from the Capture Engine to the Splunk Server. The Capture Engine and the Splunk Forwarder are always installed onto the same machine. The TA is the package that tells the Splunk Forwarder where to find the CSV files, and what to do with them. There are 2 TA’s, one for Windows and one Linux. Both TA’s are on Splunkbase, and the SplunkForwarder is on the Splunk website.
The LiveAction for Splunk App installed into a Splunk Server. The Splunk Server can be installed onto the same machine as the Capture Engine, but it is recommend to run the Splunk Server on a different machine. The Splunk Server is also offered is a cloud service called Splunk Cloud, so the LiveAction for Splunk Dashboards can be installed in the cloud as well.
The Splunk Forwarder and the Splunk Server index the CSV reports generated by a Capture Engine. In order to generate CSV reports that the SplunkForwarder will find, the capture must be named “Splunk”, and both Analysis Options and Statistics Output have to be enabled. Setting up the Splunk Forwarder to index the CSV files is described below for both Windows and Linux. The only difference between Windows and Linux is which TA package to use.
Linux TA - https://splunkbase.splunk.com/app/2746/
Windows TA - https://splunkbase.splunk.com/app/2747/
The Splunk Server indexes the data coming from the Capture Engines, and stores the data. The data from each of the CSV files is stored into a different custom index. For example, the protocol statistics are stored in the index called “sv_protocols”, and the nodes statistics are stored in the index called “sv_nodes”, and the flows are in “sv_flows”, and so on. This makes it possible to display the data for a particular index by typing “index=nodes” or “index=protocols” into the Splunk search field.
Warning: The creation and growth of these indexes will use disk space.
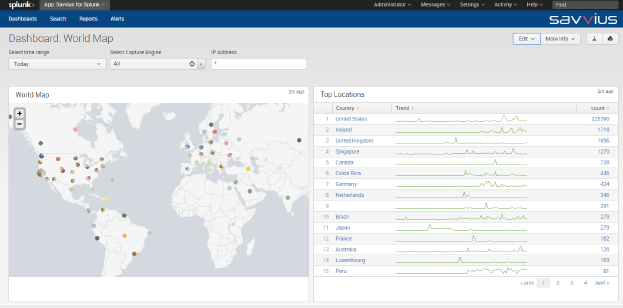
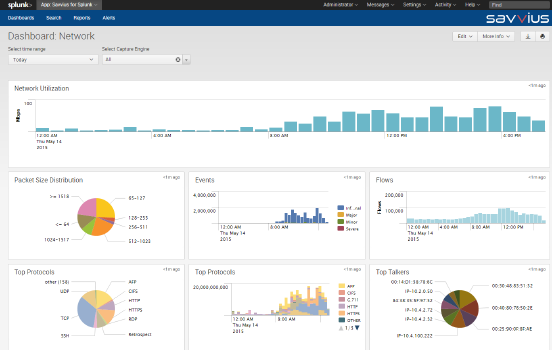
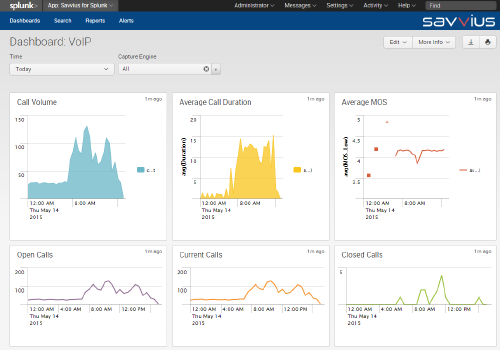
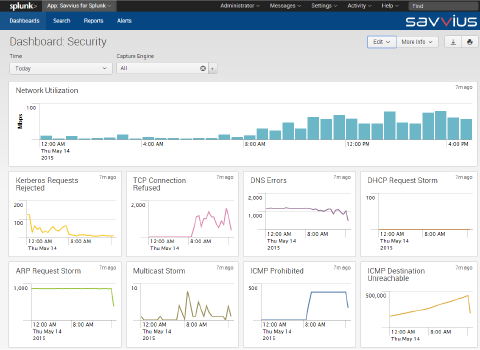
The Savvius for Splunk App provides dashboards in the Splunk UI that display network statistics from one or more Capture Engines. There are high level dashboards like the Network Dashboard, Security Dashboard, and VOIP Dashboard, which display trends about the network and the events taking place on it. There are also lower level dashboards that display list of network activity like nodes, flows, and protocols. All of the dashboards are completely web-based and can be customized and extended in many ways.
The Splunk license pricing model is usage based. The free license allows up to 500MBs per day of data to be indexed. More data can be indexed by purchasing a license. Splunk offers perpetual licenses and a term license. More on Splunk licenses can be found here: https://www.splunk.com/en_us/products/pricing.html.
none
none
Version 1.0 of the LiveAction for Splunk Network Dashboards is compatible with:
Version 1.0 of the LiveAction for Splunk Network Dashboards incorporates the following third-party software or libraries.
The timewrap app is used to implement the "compare" dashboards in the Savvius for Splunk App.
The LiveAction for Splunk Network Dashboards are supported by Savvius for customers who have purchased maintenance with their Savvius products.
LiveAction for Splunk supports the following server platforms in the versions supported by Splunk Enterprise:
To function properly, Savvius for Splunk requires the following software:
Because this add-on runs on Splunk Enterprise, all of the Splunk Enterprise system requirements apply.
Download the Savvius for Splunk Network Dashboards at https://splunkbase.splunk.com/app/2730
This document provides instructions on how to set up the Savvius for Splunk integration.
To receive data from a LiveWire (Linux) or an OmniPeek Capture Engine (Windows) download either the TA-Savvius-nix or TA-Savvius-win and follow the installations in the documentation tab for those downloads.
Once the LiveAction for Splunk App has been installed into the Splunk Server, it will appear on the Splunk Home page as “Savvius for Splunk”. Select this entry, and then select the Dashboards entry on the next page.
New Release
Important Note: This release is incompatible with all previous releases. But it's worth it. We have removed the creation and use of indexes by the app, and are using sourcetype instead.
- Changed default time to last 1 hour.
Changed icon to red V
Fixed known issues necessary for certification
As a Splunkbase app developer, you will have access to all Splunk development resources and receive a 10GB license to build an app that will help solve use cases for customers all over the world. Splunkbase has 1000+ apps from Splunk, our partners and our community. Find an app for most any data source and user need, or simply create your own with help from our developer portal.