The add-on contains a sample dashboard and sample search that can be used for reference. In order to include the donut_chart module in an Advanced XML dashboard, use the following syntax:
<module name="HiddenSearch" layoutPanel="panel_row1_col1" group="Sample Use of a Donut Chart" autoRun="True">
    <param name="search">index=_internal | stats count AS values by group series | sort - values | stats list(series) AS categories list(values) AS data BY group | rename group AS name</param>
    <param name="earliest">-7d</param>
    <module name="DonutChart">
      <param name="palette">#4572A7,#AA4643,#89A54E,#80699B,#3D96AE,#DB843D,#92A8CD,#A47D7C,#B5CA92</param>
    </module>
  </module>
NOTE: The default palette contains 9 colors. If your search yields more than 9 events -- which would create more than 9 inner-slices of pie -- you will need to provide a palette with more color selections, or risk your donut chart showing only shades of gray.
Three fields must be present or calculated in your data to produce donut charts:
name - this represents the label for an inner-ring pie slice.
categories - this contains the label for each outer-ring sub-division of a pie slice; it can be a multi-valued field or a comma-separated list.
data - this contains the values for each outer-sing sub-division. It can be a multi-valued field or a comma-separated list, and it needs to be sorted to map each value's position to the respective position in the cateories field. The add-on will calculate percentages based on these values.
Here is a sample search that will produce the desired output:
index=_internal | stats count AS values by group series | sort - values | stats list(series) AS categories list(values) AS data BY group | eval categories=mvindex(categories, 0, 10) | eval data=mvindex(data, 0, 10) | rename group AS name
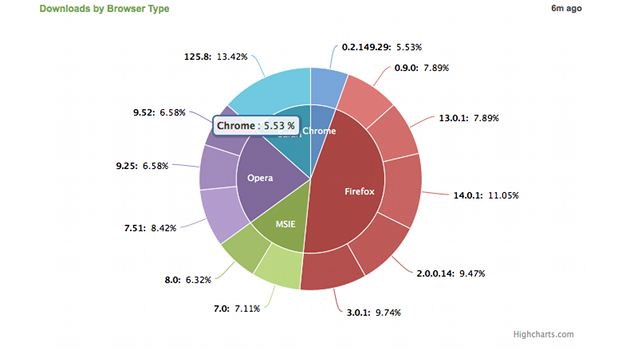
The output will look as follows:
NAME
CATEGORIES
DATA
per_host_thruput
ubu.local
182
torrent.altf4.com
3
na1.lab.local
1
per_index_thruput
_internal
512
netapp
400
netapp_perf
381
As a Splunkbase app developer, you will have access to all Splunk development resources and receive a 10GB license to build an app that will help solve use cases for customers all over the world. Splunkbase has 1000+ apps from Splunk, our partners and our community. Find an app for most any data source and user need, or simply create your own with help from our developer portal.